Objective
Where can an offshore energy platform actually go? The answer is the intersection of several independent constraints: the site has to sit inside the right jurisdiction, in water shallow enough to build in, with ocean conditions the hardware can survive. This project built a mapping system in QGIS that layers those constraints — exclusive economic zones, ocean depth, sea-surface temperature, and weather — and intersects them into a single map of viable siting regions.
The Layers
Each input answers a different question about a candidate site:
- Exclusive economic zones (EEZs) — the jurisdictional layer. EEZ boundary polygons establish which national waters a site falls under, which determines who can permit, build, and operate there.
- Ocean depth (bathymetry) — the structural layer. Depth drives the foundation choice — fixed-bottom platforms only pencil out to a certain depth, beyond which floating designs (and their costs) take over — so gridded depth data bounds where each platform class is feasible.
- Sea-surface temperature — NOAA SST data characterizes the thermal environment the equipment operates in.
- Weather — NOAA weather data captures the prevailing conditions a platform must be engineered for — and, for energy generation, the resource itself.
- Wave height & periodicity — the exclusion layer. Significant wave height and wave period set the mechanical loading a platform endures; regions whose wave climate exceeded what the structures could tolerate were ruled out, regardless of how well they scored on everything else.
Intersecting the Layers in QGIS
The datasets arrive in incompatible shapes — vector boundary polygons on one hand, gridded rasters at different resolutions and projections on the other — so the first job is normalization: reproject everything to a common CRS and clip it to the area of interest. The EEZ polygons then act as the jurisdictional mask, and each environmental raster is thresholded into a binary suitable/unsuitable layer — depth within the buildable range, temperature and weather within operating limits, wave height and period below the structural cutoff.
With every criterion reduced to the same form, the intersection itself is a raster-calculator product: a cell survives only if it passes every test. The result is a composite suitability map — the regions where jurisdiction, seabed, and ocean climate all line up — with the wave-climate exclusion carving away areas that looked attractive on depth and weather alone.
Resulting Maps
The exports below show the assembled system: EEZ polygons (teal) over the basemap, the environmental rasters shading the open ocean behind them, highlighted exclusion zones in coral, and the surviving testable areas circled in red — one view covering the Atlantic and the Americas, the other the Indian Ocean and Asia–Pacific.
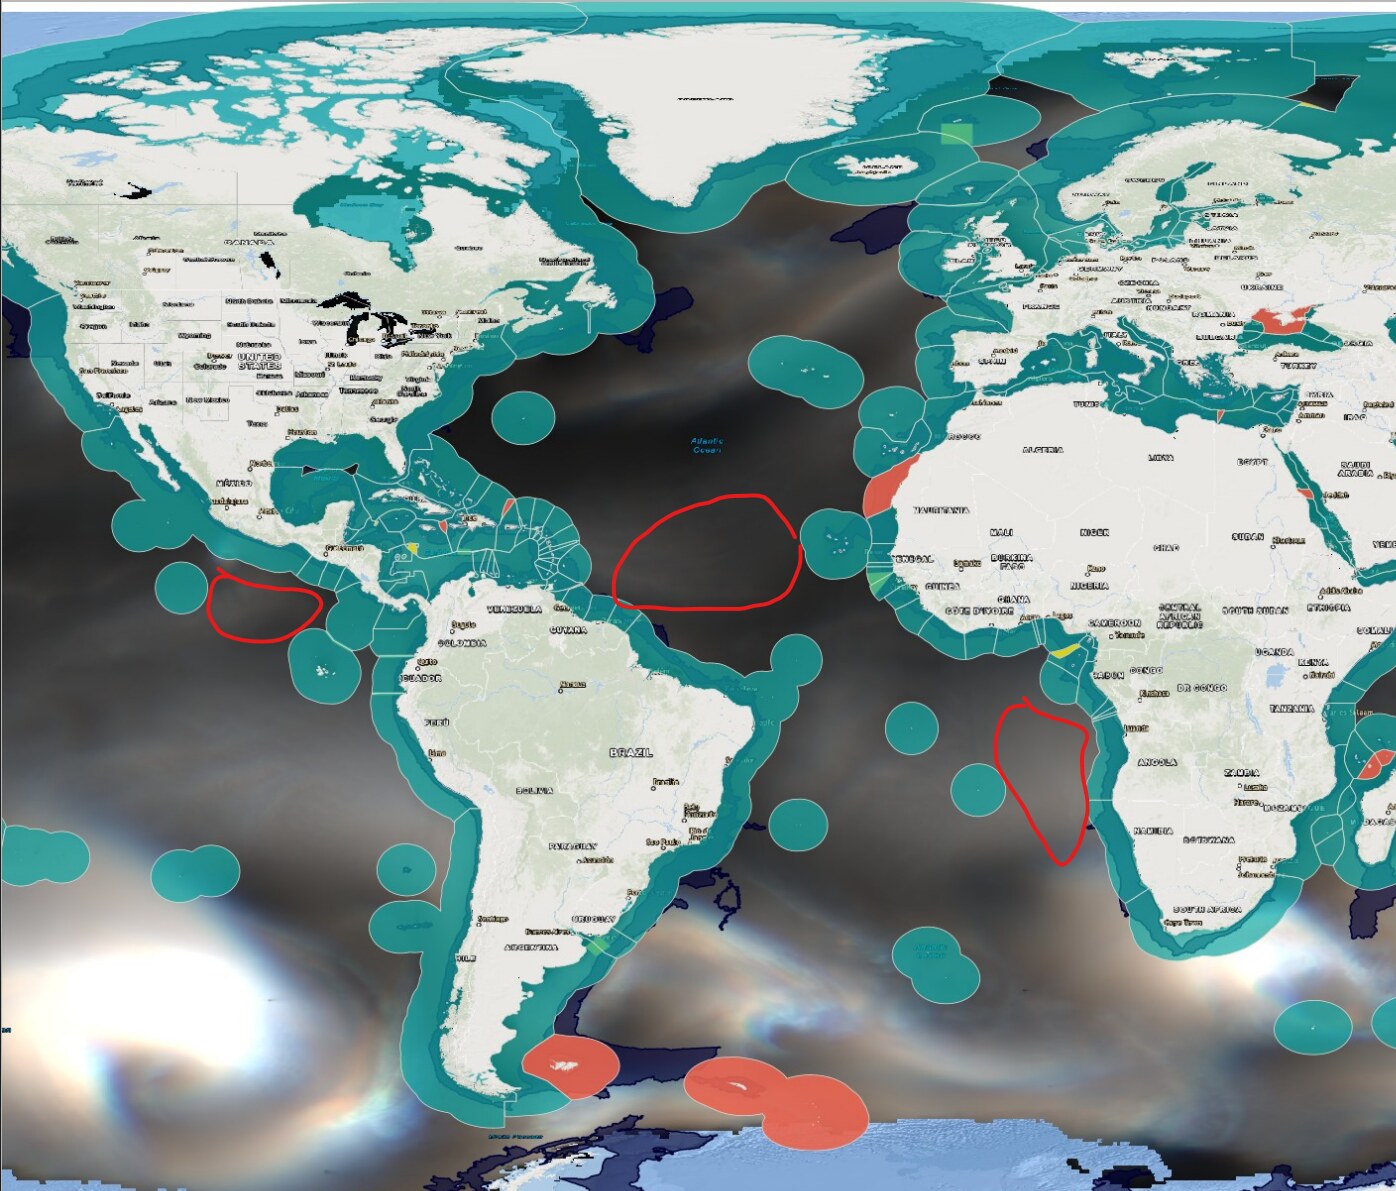
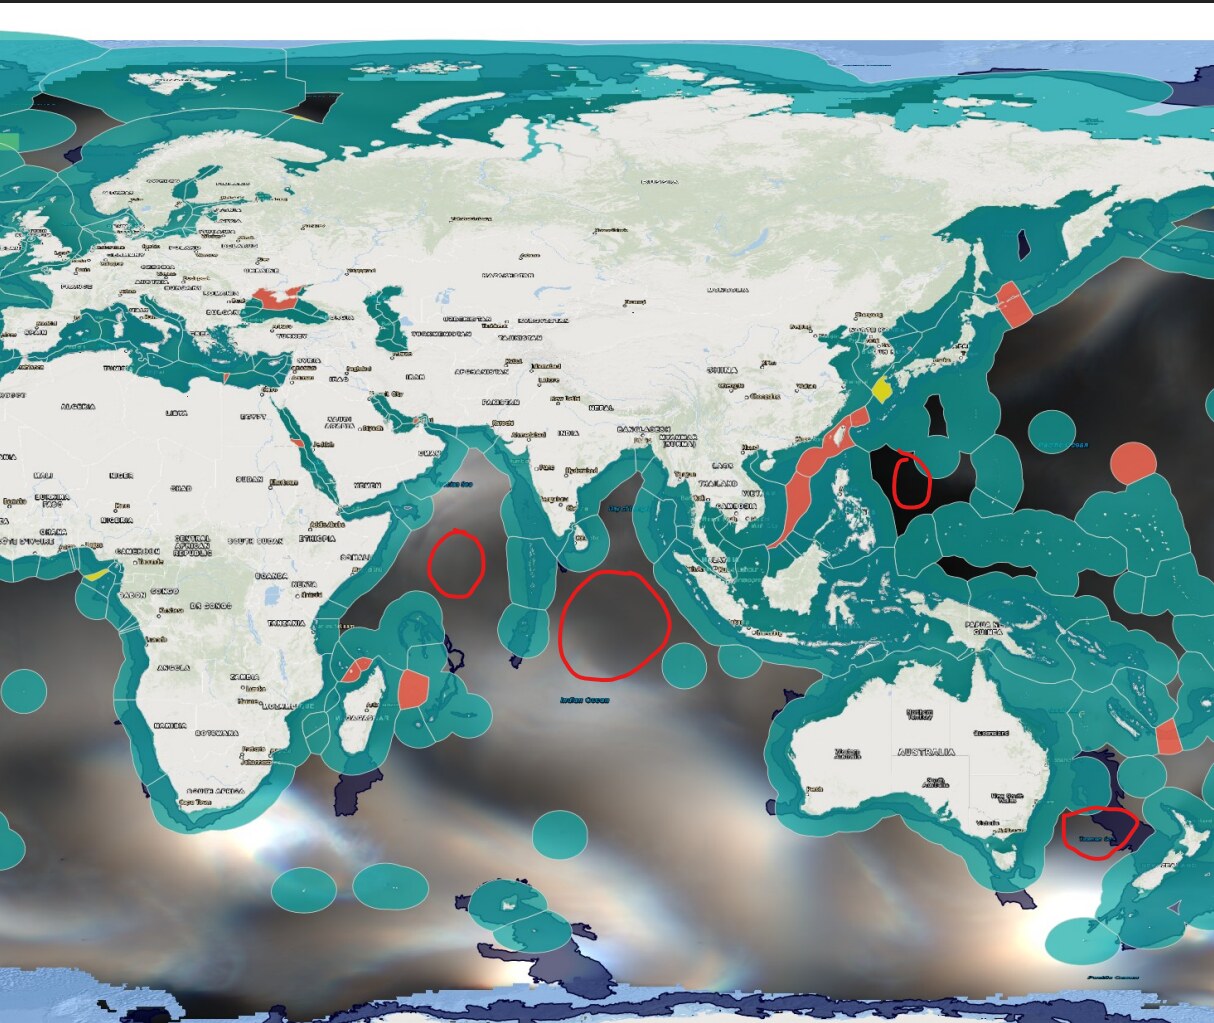
Tap any image to open it full size.
Takeaway
The value of the system is less any single map than the workflow: once the layers are normalized and thresholded, swapping in a different platform's constraints — a deeper floating design, a hardier wave tolerance — regenerates the siting picture in minutes instead of restarting the analysis.